

Business Dashboard: The Guide to Steering Your SME
A business dashboard turns scattered figures into clear decisions. This guide shows you how to design one, which indicators to choose and how to move from a spreadsheet to a real management tool tailored to your business.
Why your company needs a business dashboard
Many business owners find out too late that cash flow has tightened, that key customers haven't paid or that an activity no longer generates any margin. Running a business on gut feeling leaves you exposed to surprises like these.
A business dashboard is a strategic and operational management tool that gives a concise view of what matters. It is not a lengthy report: it is a clear, up-to-date screen designed for decision-making.
The benefits for the owner of a small or medium-sized business are concrete:
- Anticipate problems: spot a cash-flow dip or a drop in revenue before it is too late.
- Guide action: trigger customer payment reminders, adjust orders or change a sales strategy in response to the gaps you observe.
- Communicate with your team and funders: present clear results at a management committee meeting or a team check-in.
This article is for business leaders in Morocco and internationally, whatever their sector: services, e-commerce, distribution or industry.
What is a business dashboard? Definition and key principles
A business dashboard is a visual, dynamic tool that presents key performance indicators tied to the company's objectives. It differs from a static report because it is designed to trigger action, not to archive data.
Think of a car dashboard: the speedometer shows your sales pace, the fuel gauge represents your available cash, and the warning lights flag a late payment, a stockout or a budget variance. At a glance, you know whether to speed up, brake or refuel.
To play this role, a dashboard follows a few principles:
- Regular updates: daily, weekly or monthly depending on the type of indicator.
- Comparison against a target: actual vs. budget, current period vs. previous period.
- Visual alerts: color codes, alert thresholds and trends that draw attention to what requires action.
- Direct link to strategy: it connects operational performance to management's objectives.
A dashboard that is rarely consulted, or that compiles figures without context, is not a management tool.
The main types of business dashboards
There are generally three types of dashboards, each tied to a time horizon and a level of decision-making:
- The strategic dashboard covers the long term. It serves management and partners.
- The budget and financial dashboard focuses on an annual or monthly horizon: resources, accounting, forecasts.
- The operational dashboard supports day-to-day work: production, sales, incidents.
In small organizations, these roles can be combined into a single well-structured dashboard. This is often a natural step in an SME's digital transformation.
The strategic dashboard
It answers one question: is my company moving in the right direction over the medium and long term? The Balanced Scorecard method suggests organizing it around four perspectives:
- Financial perspective: revenue growth, operating income, margin rate, return on investment.
- Customer perspective: retention rate, customer satisfaction, market share in new segments.
- Internal process perspective: delivery time, number of complaints, meeting commitments.
- Learning and innovation perspective: training, skills acquired, adoption of new tools.
Each department can have its own indicators aligned with the overall strategy. This dashboard is usually reviewed by the management committee.
The budget and financial dashboard
Cash flow is a frequent source of strain in small and medium-sized businesses. The budget dashboard compares budget to actuals, detects drift and triggers corrective action. Its usual indicators:
- Monthly and year-to-date revenue, compared with budget and the previous year.
- Gross margin, operating expenses, operating income.
- Net cash, working capital, working capital requirement.
- Average customer payment time and outstanding supplier balances.
It draws on accounting, invoicing and banking data. A clear visual presentation (trend lines, alert gauges, forecast/actual/variance columns) makes it readable at a glance.
The operational dashboard
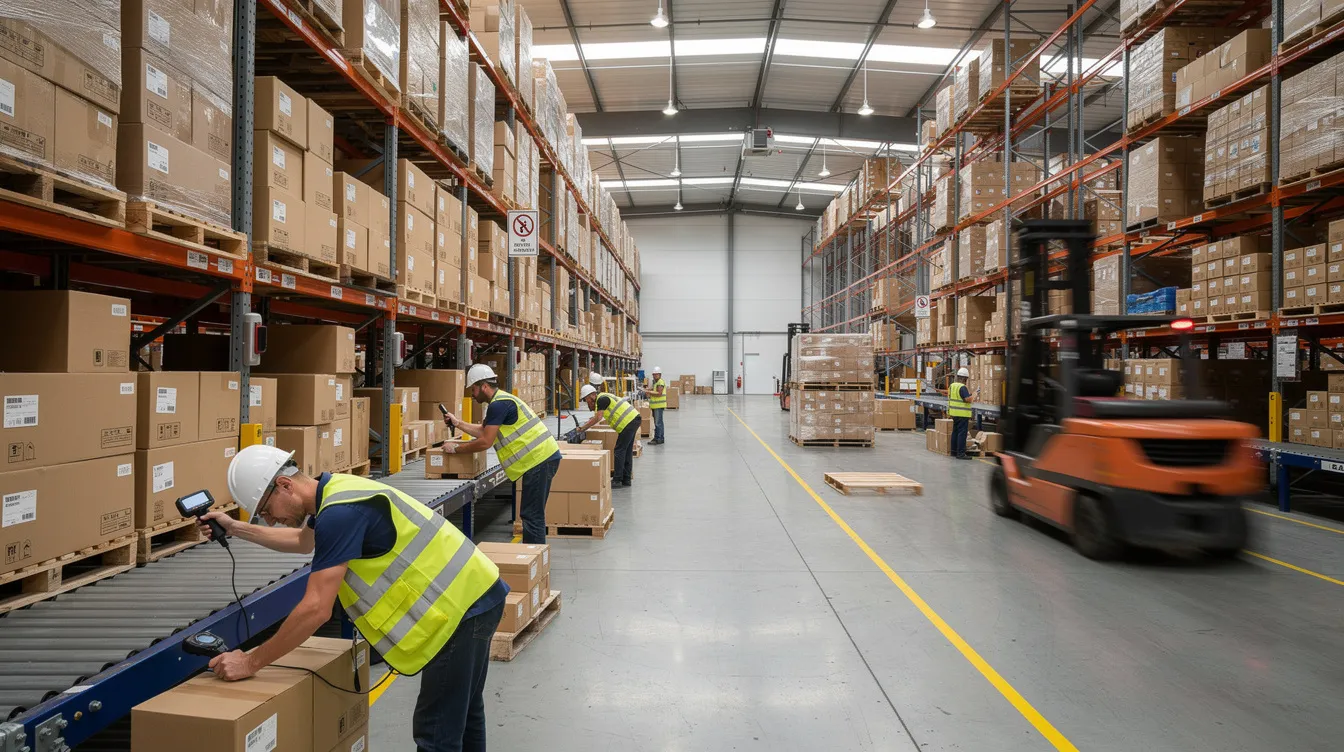
This dashboard is used by business owners, team leaders and project managers to run day-to-day operations and make corrective decisions quickly. The indicators vary by sector:
- E-commerce: orders processed, response time to customer requests, conversion rate.
- Logistics or industry: on-time deliveries, stockouts, inventory turnover (see our guide to inventory management software).
- Services: number of interventions, meeting deadlines, productivity.
A small number of well-tracked indicators is better for keeping attention on what matters. This is often the type of dashboard very small businesses start with.
Key performance indicators: how to choose the right KPIs
A dashboard is only relevant if its indicators are directly tied to the company's objectives. KPIs work best when they are SMART: specific, measurable, achievable, realistic and time-bound. Each indicator should also have a clear definition, a reliable source and an owner.
Here are examples of indicators by area:
| Area | Example indicators |
|---|---|
| Finance | Gross margin, net cash, working capital, operating income |
| Sales and marketing | Conversion rate, customer acquisition cost, average order value |
| Human resources | Turnover, absenteeism, personnel costs as a share of revenue |
| Production and logistics | Service level, stockouts, cycle time |
| Quality and satisfaction | Customer satisfaction, complaint rate, resolution time |
A few well-tracked indicators are better than dozens of metrics. Review your selection regularly: priorities change with the market and your strategy.
Steps to create an effective business dashboard
A good dashboard answers three questions: where are we?, where should we be? and what do we need to do now?
- Clarify your objectives. Start from your concrete priorities: securing cash flow, increasing sales, reducing delivery times.
- Identify your data sources. List your systems (ERP, CRM, invoicing, e-commerce site, spreadsheet) and check their reliability, export format and update frequency. Automation should be the goal.
- Define your indicators. For each KPI, specify the calculation formula, source, frequency, owner and target.
- Design the visual layout. One clear screen, sections by theme (finance, sales, operations), and simple color codes (green, orange, red) to flag variances.
- Test and adjust. Have the first version validated by its future users (owner, operations manager, accountant), gather their feedback and adjust.

Spreadsheet or custom solution: choosing the right tool
Many companies start with a spreadsheet, and that is a perfectly valid way to begin: little data, a few KPIs, quick setup.
Its limits show up as the business grows, however: data-entry errors, manual updates, difficult sharing between colleagues, multiple versions of the same file.
A dashboard built into custom software (ERP, CRM or a business-specific tool) eliminates manual compilation, consolidates multiple sources, manages access rights per user and keeps a history. It can also include predictive analytics components to analyze trends and produce forecasts.
Setting up a business dashboard with UnzipTech
UNZIPTECH SARL, based in Fez, supports very small businesses, SMEs and large companies in Morocco and internationally with web development, mobile apps, custom software (ERP, CRM, business tools), artificial intelligence, IT consulting and SaaS solutions.
For a dashboard project, the process follows four steps:
- Listening and needs analysis: existing indicators, business processes, data sources.
- Mockup design and validation: dashboard screens and choice of KPIs with management.
- Agile development with regular check-ins: connection to existing systems, interface, access rights.
- Delivery, training and follow-up: team training, user documentation, then a maintenance and support contract if needed.
Integrating artificial intelligence lets you go further, for example with predictive analytics or automating certain tasks. Discover our custom software and request a free personalized quote after we analyze your needs.
Update frequency, governance and best practices
A dashboard is only valuable if it is consulted and used as part of a regular management routine. Frequency guidelines:
- Daily: operational indicators (orders, payments received, incidents).
- Weekly: sales indicators, production tracking, follow-ups.
- Monthly: finance, budgets, review of overall performance.
Clearly define roles: who updates, who analyzes, who decides, who follows up on action plans. A few best practices:
- Limit dashboards to those that are actually used.
- Keep a consistent layout from one screen to the next.
- Record comments and decisions made at each review.
- Make the dashboard accessible (sharing, mobile access) so that checking it becomes a habit.
Let your dashboard evolve as the company grows rather than leaving it frozen.
FAQ: everything you need to know about the business dashboard
What is the difference between a dashboard and reporting?
Reporting is a backward-looking summary: it compiles results. A dashboard is a decision-oriented management tool: it sets each indicator against a target, a variance and an action.
How many indicators should a dashboard include?
As few as possible: only those tied to your objectives and actually tracked. Beyond that, the dashboard loses clarity.
Can I start with a simple spreadsheet?
Yes, it is a good way to start. Just plan to move to a more structured tool when your data volume or need for automation grows.
How do I connect my dashboard to my existing tools?
Identify your systems (CRM, ERP, invoicing, e-commerce site) and check their export or connection options. An automated connection between these sources and the dashboard is the key to reliable updates.
When do I need a custom business dashboard?
When data becomes plentiful, user profiles multiply, or you need alerts and forecasts that a spreadsheet can no longer handle easily.
How can UnzipTech help me?
By analyzing your needs, defining KPIs with you, developing a custom tool connected to your systems, and then training your teams. Contact us for a free personalized quote after we analyze your needs.