
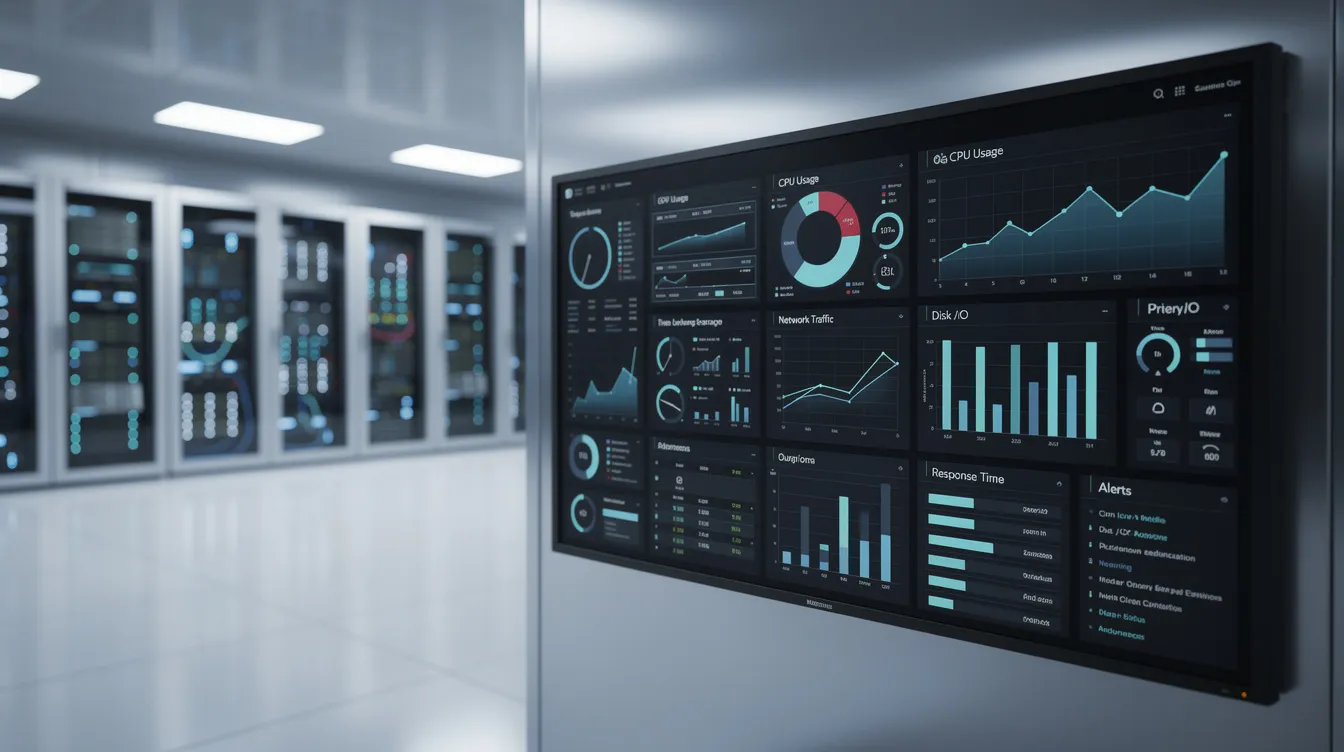
Your applications are at the heart of your business. Website, mobile app, ERP or SaaS platform: how well they run determines your users' satisfaction, your teams' productivity and your revenue. Yet many companies have no visibility into the real state of their applications and discover problems at the same time as their customers.
Application monitoring addresses this need: continuously monitoring the performance, availability and quality of service of your applications to detect incidents before they become critical. With applications that are increasingly distributed (cloud, APIs, third-party services), this practice is becoming a basic part of operations.
This article is for managers and IT leads at micro-businesses, SMEs and large companies, in Morocco and internationally. UnzipTech, a software development agency based in Fès, designs, develops and maintains web, mobile and business applications, and offers hosting, monitoring and backup for the online platforms it operates. Here we present a practical approach to application monitoring: definition, stakes, key performance indicators, tools, and how it connects with maintenance and the disaster recovery plan.
Definition of application monitoring and how it relates to IT monitoring
Application monitoring is one building block of IT monitoring. It focuses on the performance and availability of applications (web, mobile, SaaS or packaged business software) and on what users actually experience. It monitors applications in real time and makes it possible to detect incidents and slowdowns quickly.
Here is how it fits with the other dimensions of monitoring:
- Application monitoring: transactions, response times, errors and success rates of user journeys.
- Network monitoring: connectivity, bandwidth, latency and network equipment (routers, switches, firewalls).
- Technical / infrastructure monitoring: servers, containers, databases, storage, CPU and memory resources.
- Application Performance Monitoring (APM): a more complete approach that combines metrics, logs, distributed traces and root cause analysis.
Effective monitoring covers technical, functional and operational aspects alike, and is best planned from the design stage of applications rather than added as an afterthought.
Monitoring is not maintenance: it observes, measures and alerts. Maintenance, whether corrective, preventive or evolutive, comes next to fix and improve. The two are complementary. To place monitoring within a broader DevOps approach, read our article Cloud and DevOps: what every SME should know.
What is at stake with monitoring: service continuity and user experience
Why invest in application monitoring? Because it directly affects your business stakes.
- Service continuity: an unavailable invoicing application, CRM, online store or booking platform disrupts the business. An undetected performance degradation can end in a service outage.
- User experience: a slow website, a form that does not respond or a mobile app that crashes generate frustration, abandonment and loss of trust. Automated alerts make it possible to step in before the situation gets worse.
- Internal productivity: when business software is unavailable, your teams can no longer work. Monitoring helps reduce the time to detect and resolve incidents.
- Traceability: monitoring documents every event (date, duration, impact, cause), which is useful for your internal reviews and your contractual commitments.
- Trust: it contributes to the availability of critical services and preserves the trust of your customers and partners.
The stakes of monitoring therefore go beyond the technical scope: they concern every company undergoing digital transformation.
What application monitoring actually observes
Application monitoring covers several layers of your information system:
- Front-end: performance of the website or mobile app, load times, interactivity, JavaScript errors.
- Back-end: operation of APIs and microservices, response times, error rate, throughput.
- Database: slow queries, locks, latency.
- Infrastructure: servers, containers and cloud services, CPU, memory and disk space usage.
- Network: latency, link availability, CDN performance.
It continuously collects three types of data, often called the three pillars of observability:
- Metrics: error rate, response time, number of requests per minute, resource usage.
- Logs: application event logs, errors, warnings, security events.
- Traces: end-to-end tracking of a request, from the user's click to the API, the database and the response.
In a multi-cloud or hybrid context, monitoring must also cover the third-party services the application depends on: payment gateway, email or SMS delivery, partner APIs. Without this coverage, blind spots remain exactly where outages are often the hardest to diagnose.
User experience monitoring: from response time to error rate
User experience monitoring (Digital Experience Monitoring) goes beyond technical metrics: it measures quality of service as your end users perceive it. A few examples:
- Load time of a booking page or checkout funnel: a slowdown on these pages weighs directly on conversion.
- Payment validation time on an e-commerce site: too long a wait increases the risk of abandonment.
- HTTP error rate (4xx/5xx) on an API: a sudden spike signals a malfunction to be handled quickly.
Two complementary approaches exist:
- Real User Monitoring (RUM): collection of real user data (browser, device, country, actual load time).
- Synthetic monitoring: automated simulation of critical journeys by robots, to detect a problem before real users are affected.
A real-time dashboard then lets support or the product owner follow perceived performance by country, browser or device type.
Key performance indicators (KPIs) to track in application monitoring
Key performance indicators turn technical data into actionable information. Here are the KPIs to configure first:
- Availability (uptime): share of time the application is accessible. The target is set according to the criticality of each application and your contractual commitments.
- Average response time and percentiles (p95, p99): the average is not enough; percentiles show the experience of users in the worst conditions.
- Error rate: HTTP errors, application exceptions, failed transactions.
- Throughput: number of requests or transactions processed per minute.
- CPU and memory usage: saturation of servers or containers.
- Database performance: slow queries, latency, locks.
- Queues and scheduled tasks: pending emails, stuck reports, failed jobs.
- MTTR (Mean Time To Resolve): average time to resolve an incident, revealing how responsive the organization is.
Formalizing SLIs (indicators), SLOs (objectives) and, where applicable, SLAs (contractual commitments) helps align technical performance with your business objectives: orders, confirmed bookings, processed cases.
For an SME, there is no need to track dozens of metrics. A few well-configured indicators, aligned with critical applications and reviewed regularly, are better.
Practical table: what to monitor, why, and an example alert
This table can serve as a basis for defining the monitoring scope. The thresholds shown are examples to adapt to each application. Alerts must remain actionable to avoid "alert fatigue" in teams.
| What is monitored | Why it matters | Example alert (thresholds to adapt) |
|---|---|---|
| HTTP availability of the website | Detect an outage before users do | "Site unreachable for 2 minutes (5xx errors)" |
| Response time of a critical API | Prevent degradation of the user journey | "Average response time > 2 s for 5 minutes on the payment API" |
| Application error rate | Identify a software malfunction | "Error rate > 5% over the last 10 minutes (booking service)" |
| CPU / memory saturation | Anticipate a slowdown or a shutdown | "CPU > 90% for 10 minutes on the main server" |
| Disk space | Avoid a sudden shutdown due to lack of storage | "Remaining disk space < 10% on the database server" |
| Database response time | Spot slow queries or missing indexes | "Query > 5 s detected on the orders table" |
| Backups | Check that backups run | "Nightly backup failed: no backup for 24 h" |
| Network latency | Distinguish a network problem from an application problem | "Abnormal latency between the application and the database" |

Monitoring tools: from simple monitoring to APM platforms
The choice of tools depends on your environment and your level of maturity. The main families:
- Infrastructure monitoring tools: servers, network and equipment (CPU, memory, disk, bandwidth).
- APM platforms: collection of telemetry data such as response time and error rate, distributed tracing and root cause analysis, to detect anomalies before they affect users.
- Log and trace tools: collection, aggregation, search and correlation of logs. OpenTelemetry is an open instrumentation standard that facilitates interoperability between tools.
- Dashboards and visualization: tools such as Grafana centralize metrics, alerts and overall health status.
Centralizing logs, metrics and traces makes diagnosis easier and avoids piling up redundant software.
Grafana is one of the technologies UnzipTech uses in production, alongside Docker, PostgreSQL and Cloudflare. The operation of RentalMe, a car rental marketplace designed, developed and maintained by UnzipTech, relies on continuous monitoring.
For an SME or mid-sized company, the selection criteria are: ease of use, integration with the existing setup (cloud, on-premises, hybrid), alerting capabilities, clarity of dashboards and setup cost. Favor a progressive approach: start with your business applications and critical services rather than trying to monitor everything from the outset.
How to set up a progressive application monitoring approach
Application monitoring can be set up in stages, whatever the size of the company:
Step 1 – Identify critical applications. List your applications in order of priority: showcase website, online store, ERP, CRM, SaaS platform, customer portal.
Step 2 – Map dependencies. For each application, identify the building blocks it depends on: servers, databases, third-party APIs, network, backups. This map shows what to monitor first.
Step 3 – Choose a few key indicators. Select indicators aligned with your stakes: availability, response time, error rate, disk space, backup success.
Step 4 – Deploy and configure. Install the chosen tool, configure the probes and dashboards, then validate the alert thresholds with the business and IT teams.
Step 5 – Organize alert handling. Define who receives what, at what times and through which channels (email, SMS, messaging, ticketing tool), and document the procedure for each type of incident.
Team training matters as much as the tool: without ownership, even a good platform remains underused. UnzipTech can support you through these steps, from the audit of the existing setup to deployment, with training included in every delivery.
Application monitoring checklist for managers and IT leads
Use this checklist to assess your level of maturity:
- ☐ My critical applications are identified and ranked by priority.
- ☐ I know the acceptable response times for my users.
- ☐ I receive an alert if a backup fails.
- ☐ I have a simple dashboard showing the health status of my applications.
- ☐ My major incidents are logged (date, duration, impact, cause).
- ☐ I have minimal visibility on the network (link availability, latency) to distinguish an application problem from a network problem.
- ☐ A person responsible for monitoring is clearly designated.
- ☐ Alerts are reasonable in number and actually handled.
- ☐ Alert thresholds are reassessed regularly.
- ☐ I analyze performance trends over time to anticipate resource needs.
Each unchecked box is a concrete area for improvement.

Monitoring, application maintenance and recovery plan: one continuous chain
On its own, monitoring detects and alerts. It is how it ties in with maintenance, backups and the recovery plan that ensures continuity.
- Monitoring → maintenance: monitoring detects an anomaly, corrective maintenance resolves it. Security updates, patches and optimizations fall under preventive and evolutive maintenance. To go further: web application maintenance.
- Monitoring → backups: well-configured monitoring checks that backups run and alerts in case of failure. Without this check, the problem only appears when you need to restore. See our guide on business data backup.
- Monitoring → disaster recovery plan (DRP): incident logs, detection time, recovery time and affected services feed your DRP and help size the recovery procedures. Read our article on the disaster recovery plan.
Three illustrative scenarios
These generic scenarios show what monitoring brings; they do not describe client projects.
Scenario 1 – The website that is slow at certain hours. A company notices that its site becomes very slow at certain times, without knowing why. Without monitoring, it is impossible to tell whether the problem comes from the network, the application or the infrastructure. By cross-referencing network monitoring and application monitoring, the team may for example discover that the database is saturated by slow queries.
Scenario 2 – Backups that fail silently. Nobody monitors the backups of a business application. During an outage, it turns out they had been failing for weeks. A simple daily alert on backup status would have revealed the problem in time.
Scenario 3 – The unanticipated seasonal peak. A booking platform experiences a traffic peak. Without tracking response times and error rates, slowdowns go unnoticed at the key moment. Well-calibrated thresholds make it possible to adapt resources in time, without drowning the team in alerts.
FAQ: application monitoring
What is the difference between IT monitoring, network monitoring and application monitoring?
IT monitoring encompasses all layers: network, infrastructure, applications, security. Network monitoring watches connectivity, bandwidth and equipment. Application monitoring focuses on the operation and performance of your applications. For example, if your site is slow while the Internet connection is fine, application monitoring can reveal that the database is responding too slowly.
Which indicators should an SME track first?
To start: availability, response time, error rate and backup success. These indicators cover the basic needs; you will then refine them according to your context and business objectives.
Does monitoring replace application maintenance?
No. Monitoring observes and alerts; maintenance fixes, optimizes and evolves. Each feeds the other: without monitoring, maintenance lacks data; without maintenance, alerts go unanswered.
Do you need a DevOps team to set up monitoring?
No. An IT lead or an external provider can set up effective monitoring on critical applications. What matters is having a point person able to configure the tools, interpret alerts and trigger corrective actions.
How does monitoring improve the user experience?
It detects slowdowns, errors and outages as soon as they appear, ideally before users suffer them. You step in faster and limit service interruptions.
How long does it take to start minimal monitoring?
It depends on the complexity of your environment and the number of applications to cover. An audit of the existing setup makes it possible to size the approach and start with the most critical building blocks.
Moving from reactive monitoring to managed monitoring
Application monitoring is not reserved for large organizations. It protects your critical services, improves the user experience, feeds your performance indicators and strengthens the chain that links maintenance, backup and the disaster recovery plan. The most realistic approach remains progressive: start with the essentials, measure, adjust, expand.
UnzipTech designs, develops and maintains web, mobile and business applications, and offers IT consulting (audit of the existing setup, architecture, roadmap) as well as hosting, monitoring and backup for online platforms. Discover our services or request a free quote via our contact page: reply within 24 h.